Engagement Rate vs Bounce Rate (What's the Difference + Which Matters More?)
Learn the difference between engagement rate and bounce rate, how engagement rate works in Google Analytics, what a good engagement rate looks like, and how to improve both metrics.
EazyStats Team
Product & Growth · Published March 5, 2026
If you track website traffic, you've likely seen both of these metrics: bounce rate and engagement rate.
At first glance, they seem similar. Both relate to how visitors behave on your site. But most founders, marketers, and small business owners misinterpret what these numbers actually mean.
They see a high bounce rate and assume something is broken. They see a decent engagement rate and assume everything is fine. Neither assumption is always correct.
In this guide you'll learn:
- What bounce rate really means
- What engagement rate actually measures
- How engagement rate in Google Analytics works
- What a good engagement rate looks like
- How to improve both metrics
What Is Bounce Rate?
Bounce rate measures the percentage of visitors who leave your website after viewing only one page. They arrive and exit without exploring further.
Example: 100 people land on your website.
- 60 leave immediately
- 40 click through to another page
Bounce rate = 60%
For a deeper breakdown of bounce rate, including industry benchmarks and causes, read our guide: Bounce Rate Meaning (Complete Guide).
Bounce rate answers one specific question: who left your website without interacting? But it does not tell you why they left — or who stayed and engaged. That's where engagement rate comes in.
What Is Engagement Rate?
Engagement rate measures the percentage of visitors who actively interact with your website. Instead of focusing on exits, it focuses on behavior and exploration.
An engaged visitor typically does one or more of the following:
- Visits multiple pages
- Clicks internal links
- Spends meaningful time on the site
- Navigates toward product or pricing pages
- Interacts with content
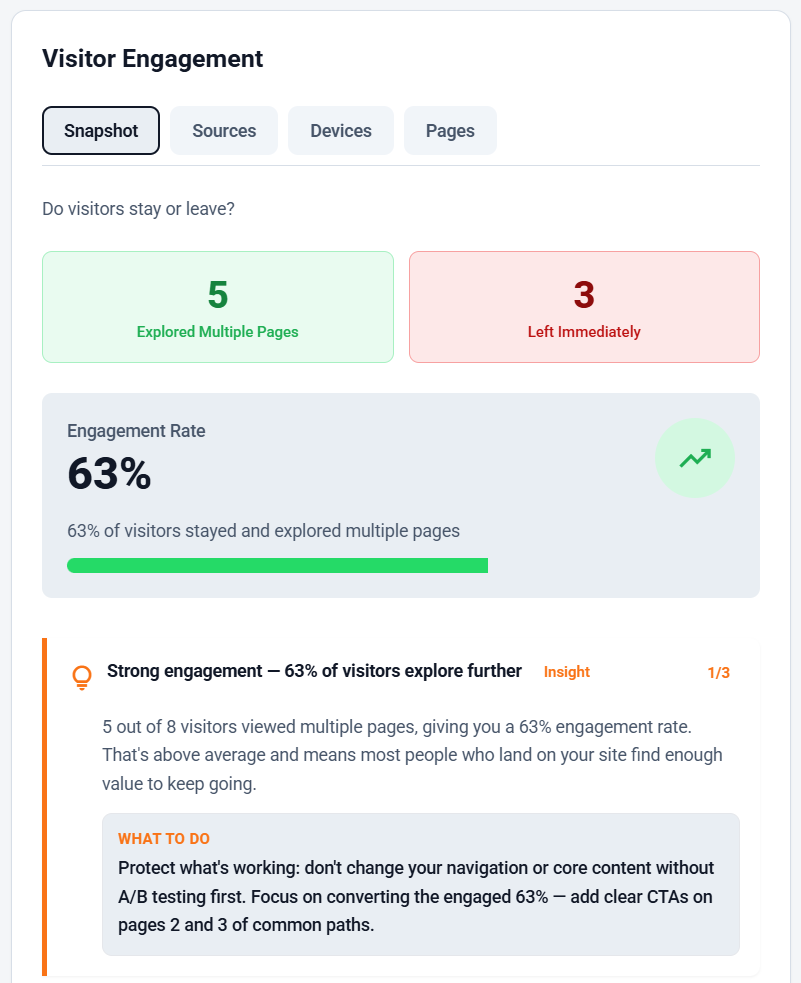
Example: 10 visitors arrive on your site.
- 7 explore multiple pages
- 3 leave immediately
Engagement rate = 70%
This is why engagement rate website metrics are often more meaningful than bounce rate alone. Bounce rate tells you who left. Engagement rate tells you who stayed and explored — and exploration is the first step toward conversion.
Engagement Rate vs Bounce Rate (Side-by-Side Comparison)
| Metric | What It Measures | What It Tells You | Focus |
|---|---|---|---|
| Bounce Rate | % of visitors who leave after one page | Who did not engage | Exits |
| Engagement Rate | % of visitors who interact with the site | Who found value | Depth of interaction |
Bounce rate asks "Who left immediately?" — Engagement rate asks "Who explored the website?"
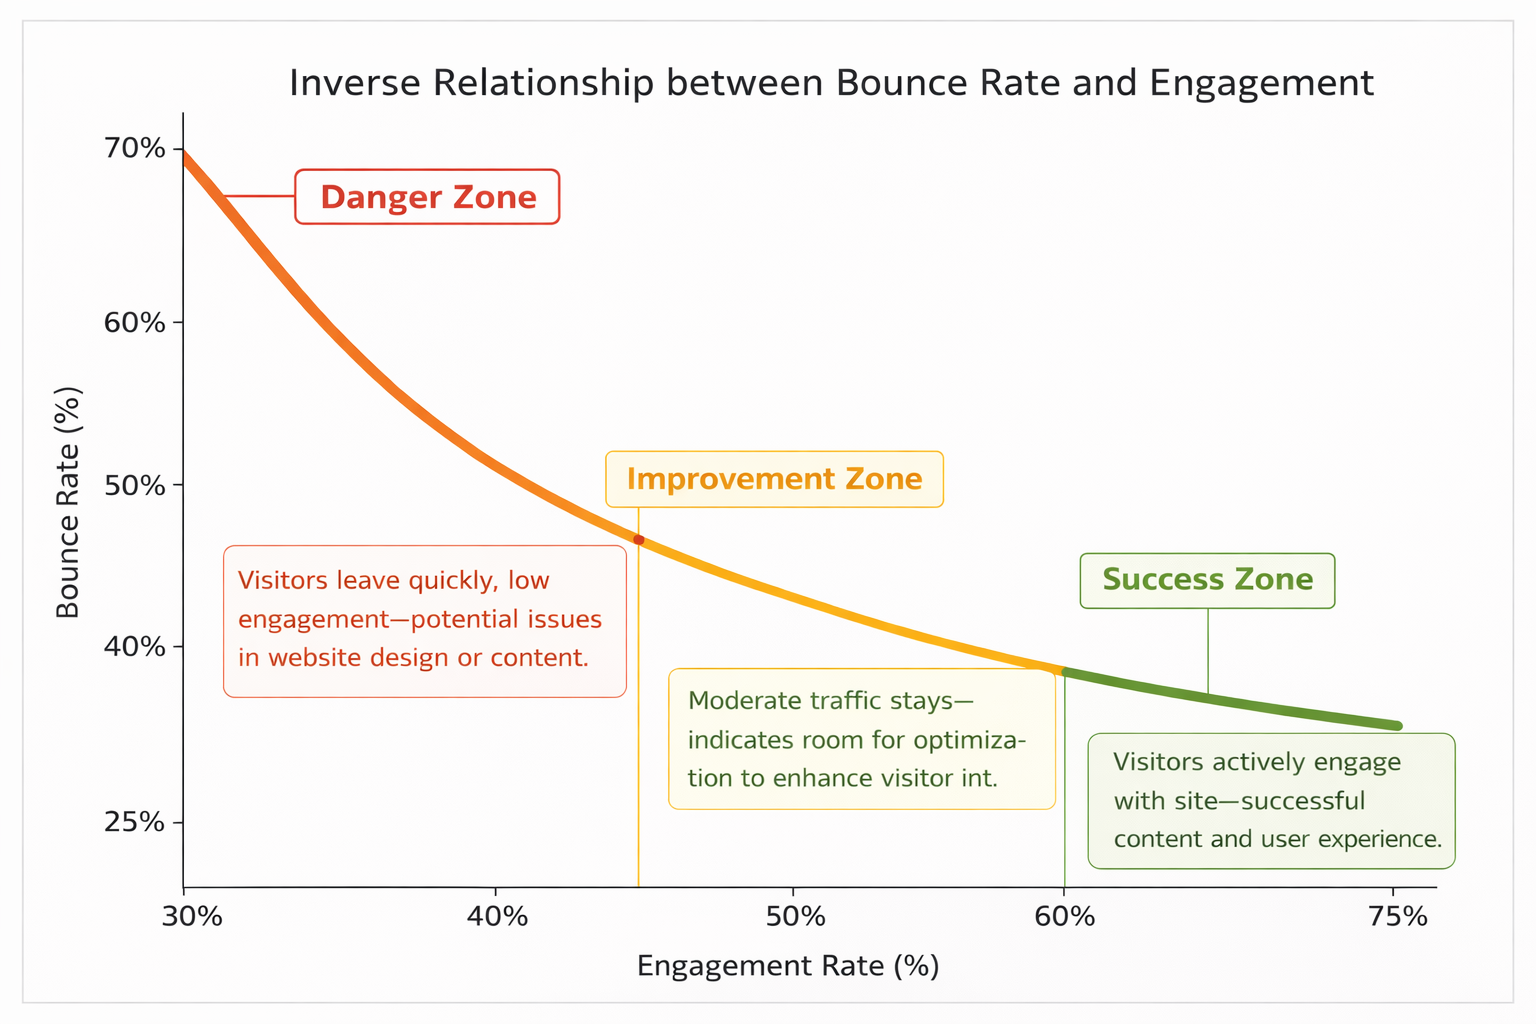
Both metrics are useful. But they tell very different stories about how your website performs.
Engagement Rate in Google Analytics
Google Analytics 4 introduced engagement rate as a core metric. But the way engagement rate Google Analytics calculates it can be confusing.
In GA4, a session is considered engaged if it meets one of these conditions:
- The visitor stays longer than 10 seconds
- The visitor views two or more pages
- The visitor triggers a conversion event
GA4 engagement can be misleading
That's why many businesses search for Google Analytics alternatives or simpler analytics for small business. If you want a clearer approach to tracking website behavior, read: Track Website Traffic Without Google Analytics.
What Is a Good Engagement Rate?
A good engagement rate varies by website type, traffic source, and industry. Focus on improving relative to your own baseline rather than chasing a "perfect number."
| Website Type | Strong | Moderate | Needs Improvement |
|---|---|---|---|
| SaaS | 60–75% | 50–60% | Below 40% |
| Content / Blog | 50–70% | 40–50% | Below 35% |
| Ecommerce | 50–65% | 40–50% | Below 35% |
Why benchmarks differ by site type
Which Metric Matters More?
If you had to choose one metric to prioritize, engagement rate is usually more actionable. Here's why.
Consider two websites:
| Website A | Website B | |
|---|---|---|
| Monthly Visitors | 1,000 | 300 |
| Bounce Rate | 70% | 25% |
| Engagement Rate | 30% | 75% |
| Multi-page Sessions | Low | High |
| Health | ⚠️ Noisy traffic | ✅ Quality traffic |
Website B is healthier — despite having a third of the traffic. Engagement indicates interest, and interest leads to product understanding, trust, and conversions. Traffic without engagement is often just noise.
Real Website Examples
Scenario 1: High Bounce + Low Engagement
100 visitors arrive. 70 leave immediately. Very few reach pricing.
This usually indicates:
- Messaging mismatch between ad and landing page
- Weak headline clarity
- Poor traffic targeting
The solution isn't more traffic — it's better clarity and positioning.
Scenario 2: Moderate Bounce + High Engagement
100 visitors arrive. 45 leave. 55 explore deeper. 20 reach pricing.
This is healthy. It means:
- Visitors understand the product
- Messaging resonates
- Traffic quality is strong
At this stage, focus should shift to improving conversions, not traffic volume.
Scenario 3: Low Bounce + Low Conversion
100 visitors arrive. 70 explore. Few sign up.
This suggests curiosity without commitment. Possible issues:
- Weak or unclear call-to-action
- Confusing navigation
- Poor funnel progression (visitors can't easily find the next step)
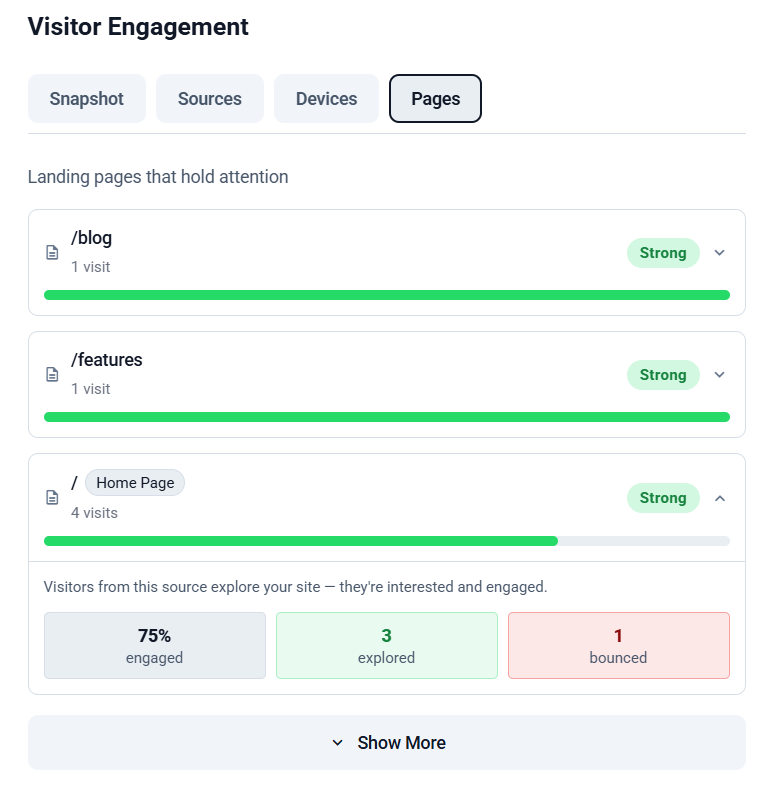
See this inside EazyStats
How to Improve Engagement Rate
1. Improve Your Headline
Within five seconds of landing, visitors should understand what the product does, who it's for, and why it matters. Confusing headlines cause immediate bounce. Clarity increases engagement.
2. Improve Internal Linking
Encourage exploration by linking related pages together. Connect blog posts to feature pages, feature pages to pricing, and use cases to demos. Internal linking creates a natural discovery path and helps search engines understand your site structure.
3. Improve Your Website Customer Journey
A healthy journey looks like:
Blog → Features → Pricing → Signup   ✅ Healthy

Blog → Exit                           ❌ Broken
Each page should clearly lead to another. Remove dead ends. Read the full playbook: Website Customer Journey: How to Map & Optimize It.
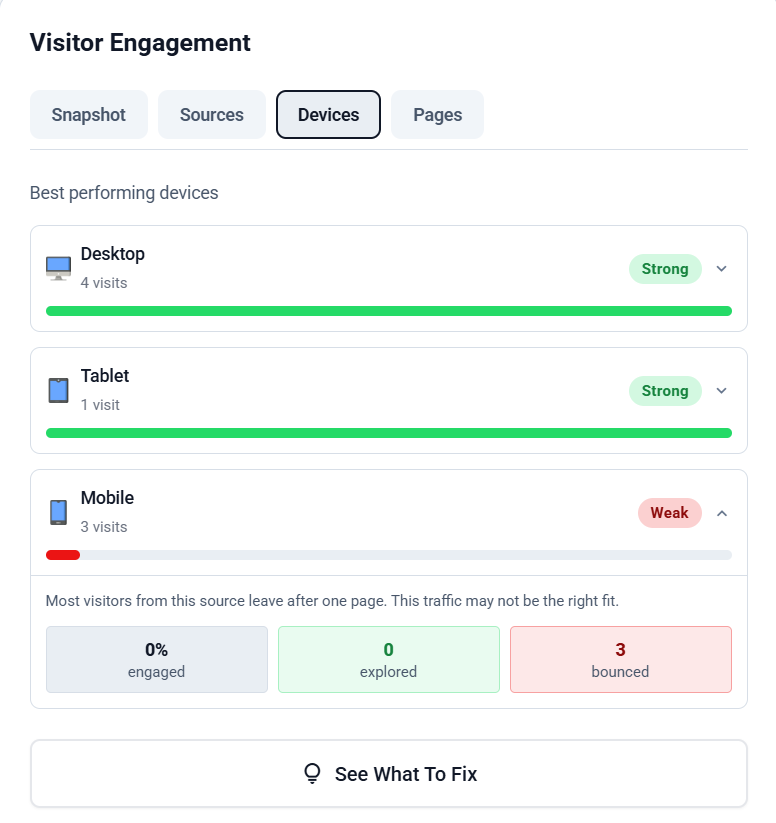
4. Improve Mobile Experience
Mobile engagement is often weaker than desktop. Check for:
- Large readable text (minimum 16px)
- Fast loading pages (under 2s)
- Clear CTA buttons (minimum 44px tap target)
- No popups blocking content on first load
Mobile friction is one of the most common causes of high bounce rate. For a full breakdown: Why Visitors Leave Your Website (17 Reasons + Fixes).
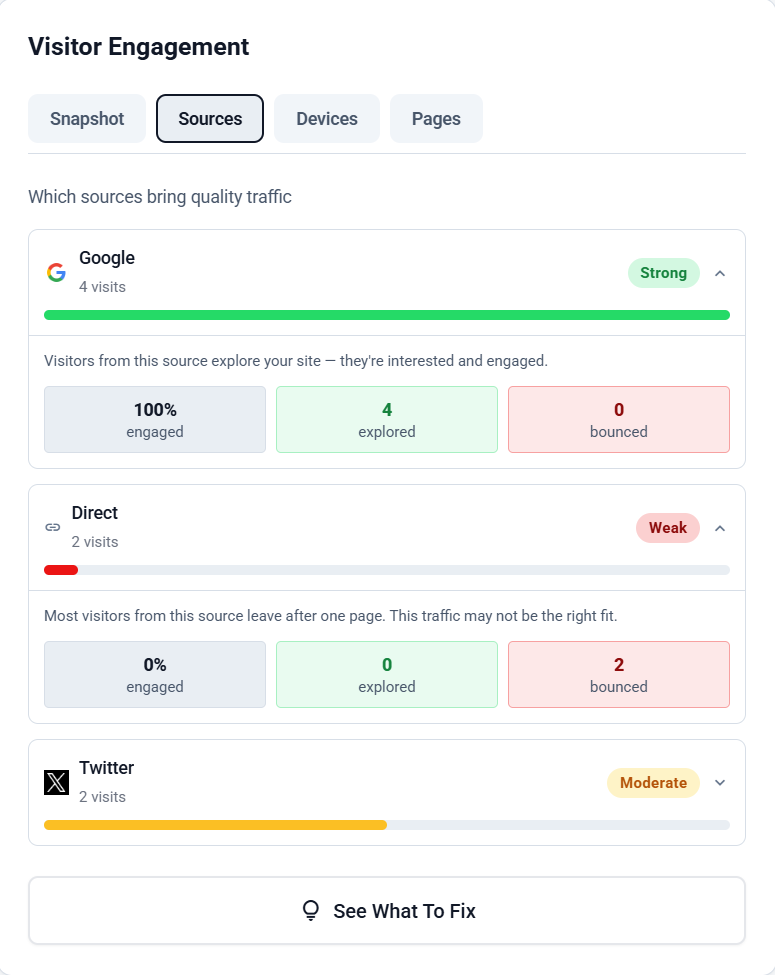
5. Align Traffic Sources
Not all traffic sources behave the same. LinkedIn may explore deeper; Facebook traffic may bounce quickly; search intent varies by keyword. Focus on channels that send engaged visitors, not just large volumes.
More on how to read traffic quality: How to Track Website Visitors (Beginner Guide).
For the complete step-by-step engagement improvement guide: How to Improve Engagement Rate.
See exactly who explored vs who left
How Bounce Rate and Engagement Work Together
Bounce rate and engagement rate are closely related — but they are not always perfect opposites. A visitor might technically engage even if they only view one page (e.g. by spending significant time reading it).
The goal is not to eliminate bounce rate entirely. The goal is to ensure engagement from the right audience. If the right visitors engage, conversions usually follow.
Why Engagement Matters for SEO
Search engines increasingly measure user behavior signals. When visitors interact with your content, it signals relevance. High engagement can:
- Increase dwell time
- Reduce pogo-sticking (returning to search results immediately)
- Signal content quality to Google
According to HubSpot research, strong engagement signals correlate with improved conversion performance.
Pogo-sticking hurts rankings
This is why improving engagement rate website metrics benefits both SEO and conversions simultaneously.
Traffic alone does not grow your business
Frequently Asked Questions
EazyStats Team
Product & Growth at EazyStats
The EazyStats team writes about web analytics, privacy, GDPR compliance, and building SaaS products that grow.
Related Articles
Bounce Rate Meaning (Deep Guide + How to Reduce It in 2026)
Learn the true bounce rate meaning, bounce rate definition, average bounce rate by industry, what a good bounce rate is, and how to reduce bounce rate step-by-step.
EazyStats Team
Mar 5, 2026
How to Improve Engagement Rate (Simple Fixes That Increase Leads + Sales)
Learn how to improve engagement rate on your website with practical fixes. Understand engagement rate in GA4, what a good engagement rate is, and how to reduce bounce rate with better journeys.
EazyStats Team
Mar 5, 2026
Average Bounce Rate by Industry (2026 Benchmarks & What's Normal)
What is the average bounce rate by industry? See 2026 benchmarks for SaaS, ecommerce, blogs, agencies, and more — and learn what a good bounce rate really is.
EazyStats Team
Mar 5, 2026
Start tracking smarter — for free
Cookie-free, GDPR-compliant analytics. Up and running in minutes.
Create free account