How to Improve Engagement Rate (Simple Fixes That Increase Leads + Sales)
Learn how to improve engagement rate on your website with practical fixes. Understand engagement rate in GA4, what a good engagement rate is, and how to reduce bounce rate with better journeys.
EazyStats Team
Product & Growth · Published March 5, 2026
Here's a painful (and common) problem:
You're getting traffic… but visitors aren't doing anything.
They land. They scroll a bit. Then they leave.
No pricing views. No demo clicks. No contact form. No trial signups.
And when you open your analytics dashboard, you see a metric like:
Engagement rate: 42% — but you still don't know what visitors did, which pages they explored, what blocked them, or what to fix first.
That's why this guide exists. You'll learn exactly how to improve engagement rate in a way that increases conversions — without turning your website into a noisy mess of popups.
Specifically, you'll learn:
- What engagement rate website metrics actually mean (in simple language)
- How engagement rate works in Google Analytics 4 (GA4)
- What a good engagement rate looks like by page type
- The 10 most common engagement killers and how to fix them
- Behavioral examples that show you what to do next
- How engagement rate connects to bounce rate — and why the pair matters
What Is Engagement Rate?
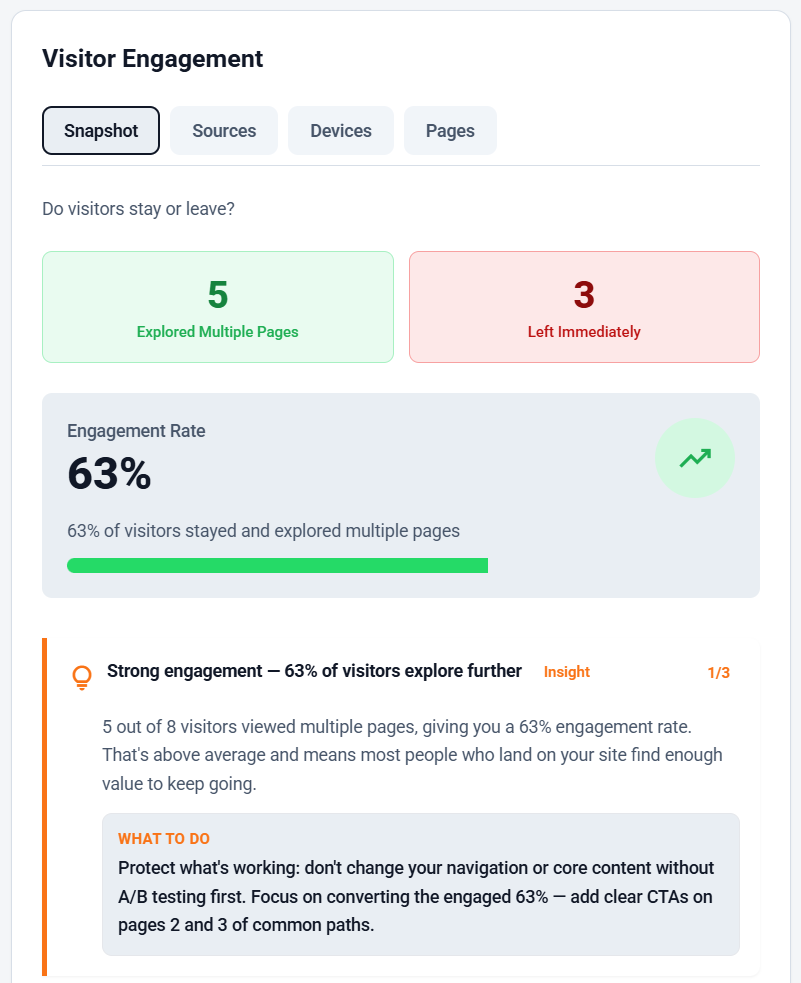
Engagement rate measures the percentage of visitors who meaningfully interact with your website instead of leaving immediately.
Engagement can look like:
- Viewing more than one page
- Clicking into features or pricing
- Staying long enough to actually read
- Scrolling and continuing deeper
- Taking a key action — demo click, signup, form submission
So engagement rate isn't a vanity metric. It's a reality check: Do visitors actually care enough to explore?
Because exploration is what leads to trust, intent, and conversions. If visitors don't engage, your website isn't guiding them — it's leaking them.
For the full side-by-side explanation of engagement vs bounce, read: Engagement Rate vs Bounce Rate.
Engagement Rate in Google Analytics (GA4)
In Google Analytics 4 (GA4), engagement rate is based on engaged sessions. GA4 counts a session as "engaged" if it meets at least one of these conditions:
- Lasts 10 seconds or more
- Includes 2+ page views (or screen views)
- Triggers a conversion or key event
Google explains engagement rate and bounce rate definitions in its GA4 documentation. (Google Help)
The problem with GA4 engagement rate
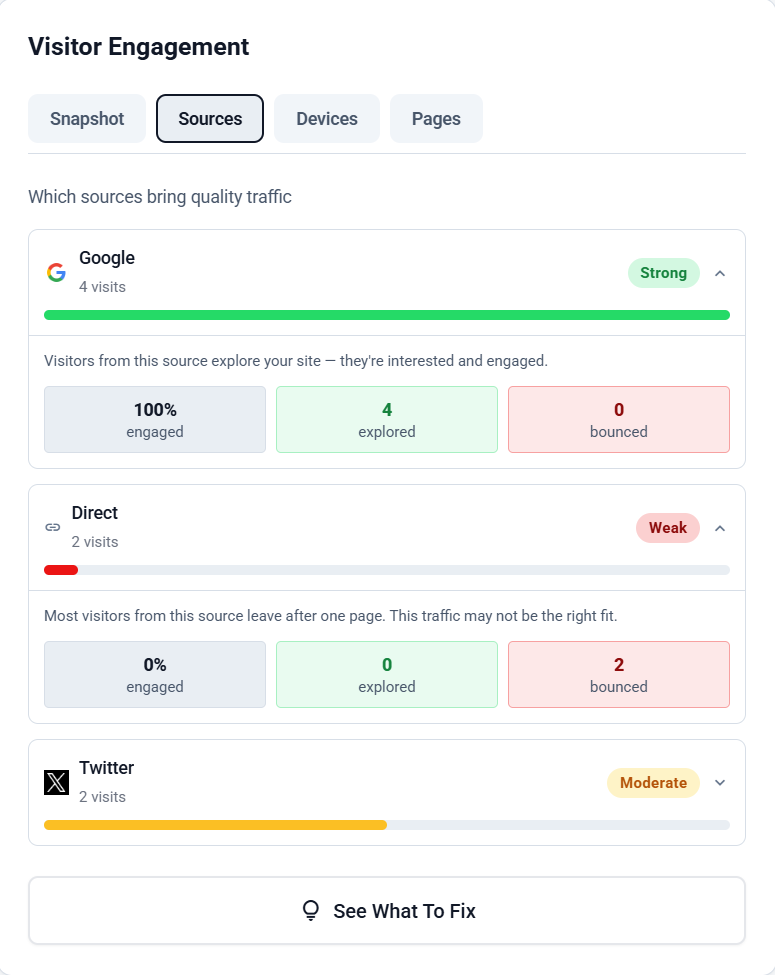
Pair GA4 engagement rate with behavioral data like pages visited after landing, pricing page reach rate, demo click rate, device breakdown, and traffic source quality for a clearer picture.
If GA4 feels too complex for quick clarity: Track Website Traffic Without Google Analytics.
What Is a Good Engagement Rate?
A "good engagement rate" depends on page type and intent. Here are practical ranges for small business websites:
| Page Type | Strong | Okay | Likely a Problem |
|---|---|---|---|
| SaaS / service homepage | 60–75% | 50–60% | Below 45% |
| Blog post | 50–70% | 40–50% | Below 35% |
| Landing page (ads) | 40–60% | 35–40% | Below 35% |
| Pricing page | Lower traffic, higher intent | Focus on conversion, not engagement% | Many visits + low conversions = trust/offer problem |
For context around what "normal" looks like by industry: Average Bounce Rate by Industry (2026 Benchmarks).
Why Engagement Rate Drops (10 Common Causes)
| # | Cause | Why It Matters |
|---|---|---|
| 1 | Visitors don't understand what you do (fast) | If your headline is vague, visitors leave before reading anything else |
| 2 | Page loads too slowly | Speed kills engagement — even a great message won't work if the page feels heavy |
| 3 | Traffic is low-intent | Engagement rate depends on who you attract, not just how many |
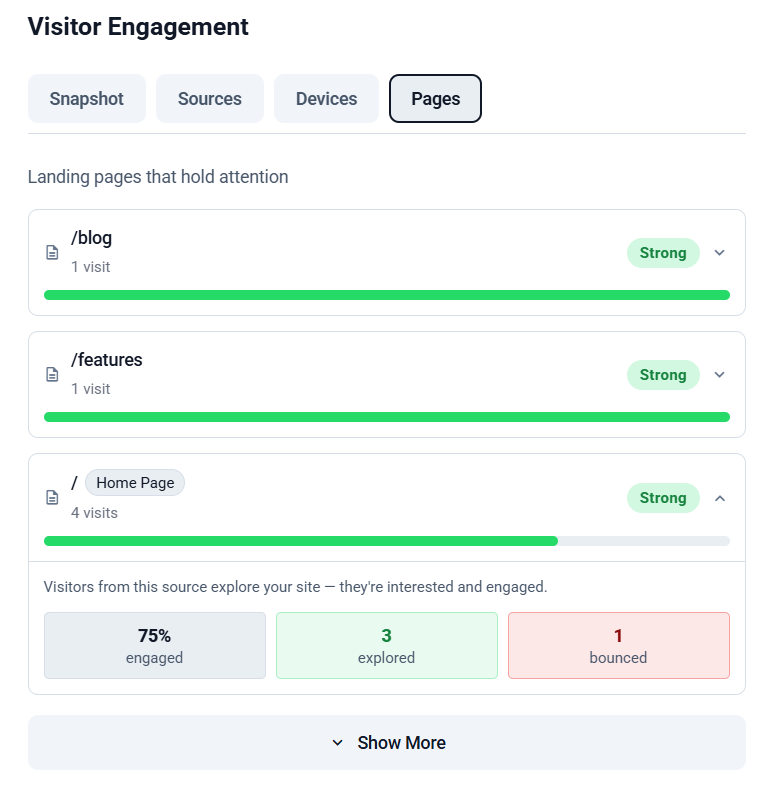
| 4 | Page is a dead end (no internal links or CTA) | A page with no next step is a bounce trap |
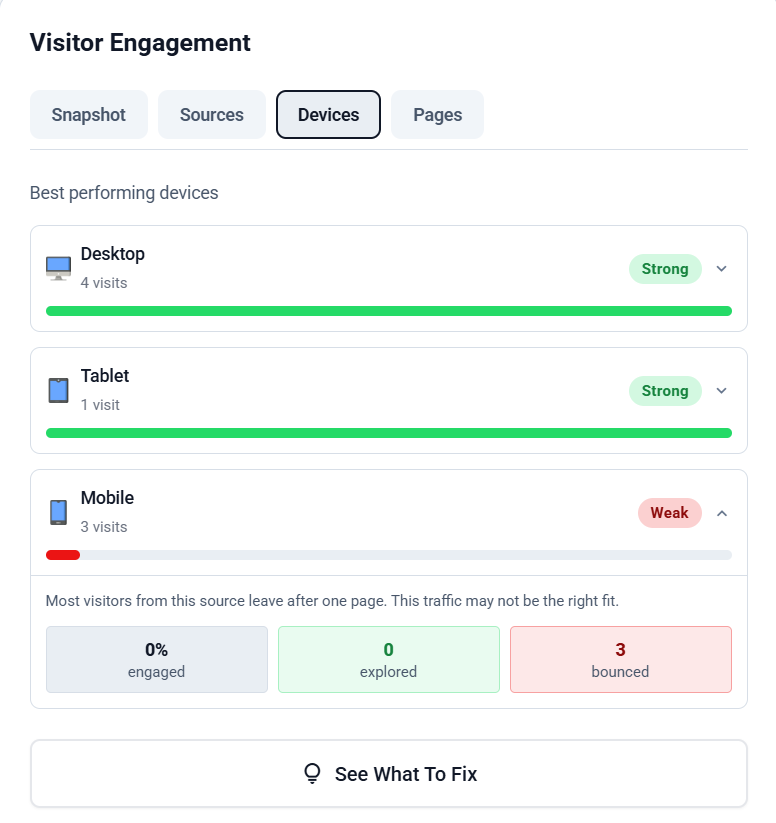
| 5 | Mobile experience is painful | Popups, tiny fonts, slow 4G load, and hard-to-tap buttons drain mobile engagement |
| 6 | CTA is unclear or too aggressive | Visitors leave if they don't know what to do next — or if you push too hard too early |
| 7 | Content is hard to scan | People skim first, then decide to read — walls of text lose them immediately |
| 8 | No trust signals | Visitors explore when they trust — no trust means no engagement |
| 9 | Page order is wrong | Showing pricing before value loses cold visitors who aren't ready yet |
| 10 | Messaging attracts the wrong audience | High engagement + low conversions = positioning problem, not a traffic problem |
Speed is the highest-leverage fix
How to Improve Engagement Rate (7 Proven Fixes)
| Fix | What to Do | Impact |
|---|---|---|
| #1 — Above-the-fold clarity | Rewrite your hero: What you do + who it's for + outcome + one clear CTA | Highest leverage — affects all visitors |
| #2 — Internal linking paths | Add links: Blog → features, features → pricing, pricing → demo. Aim for 3–5 internal links per page | Turns dead ends into journeys |
| #3 — Skimmable content | Short paragraphs (1–3 lines), bullet points, bold key ideas, headings that match real questions | Increases read rate and scroll depth |
| #4 — Mobile UX quick wins | CTA visible without scroll, easy-to-tap buttons, no blocking popups, fast on mobile data | Recovers 30–60% of mobile engagement losses |
| #5 — Traffic-to-intent match | Compare engagement by source. Tighten keywords, improve landing page match, use different pages per channel | Raises average engagement by improving inputs |
| #6 — 3-layer CTA system | Top CTA (above fold) + mid CTA (after value) + end CTA (for ready visitors). Add sticky "Try EazyStats Free →" | Captures visitors at every intent level |
| #7 — Trust before commitment | Add testimonials, customer logos, "how it works" steps, transparent pricing, security/privacy notes | Keeps explorers exploring instead of hesitating |
Fix #1 and #4 first

Real Website Behavioral Examples (What to Fix First)
| Scenario | Journey Pattern | Likely Cause | Fix |
|---|---|---|---|
| Low engagement on homepage | Google → Homepage → Exit | Unclear message above the fold | Rewrite hero section + add one clear CTA + clarify "who it's for" |
| High blog traffic, no product exploration | Google → Blog → Exit | No internal links or CTA bridge to product | Add "next step" section + internal links to features and pricing |
| Visitors explore but never reach pricing | Homepage → Features → Exit | Journey breaks before conversion step | Add pricing link, social proof, and clear "next step" CTAs |
| Pricing page has high exits | Many sessions end on pricing | Lack of value/trust before price revealed | Add FAQ, testimonials, "who it's for," clearer packaging |
| Mobile engagement is bleeding | Mobile sessions bounce fast | Speed + layout friction + popups | Optimize mobile layout first, then re-measure |
| One channel brings low engagement | Facebook → low; LinkedIn → high | Audience quality difference by channel | Double down on LinkedIn; fix Facebook targeting or pause it |
| High engagement, low conversions | Visitors explore a lot but don't convert | Weak offer, unclear CTA, wrong ICP, trust gap | Tighten positioning + strengthen proof + improve CTA placement |
Helpful reads for these scenarios:
- Best Google Analytics Alternatives for Small Business
- Track Website Traffic Without Google Analytics
- Website Customer Journey: How to Map & Optimize It
- Why Visitors Leave Your Website
- Google Analytics vs EazyStats — Side-by-Side Comparison
- How to Track Website Visitors (Complete Guide)
- Average Bounce Rate by Industry (2026 Benchmarks)
Engagement Rate vs Bounce Rate
You can't improve engagement rate properly if you only chase bounce rate.
- Bounce rate tells you who left quickly (one-page sessions)
- Engagement rate tells you who stayed and explored
They work together. If your bounce is high and engagement is low, you likely have clarity problems, speed problems, traffic mismatch, or poor internal linking.
These two posts support each other:
See This Inside EazyStats
Many analytics tools show engagement rate as a single number. EazyStats is designed to show what engagement looks like in behavior:
- Who explored multiple pages
- Which pages they visited next
- Who reached high-intent pages (features / pricing / demo)
- Where people dropped off in their journey
- Which channels bring buyers vs browsers
This is what turns an engagement rate number into a decision.
See engagement clearly inside EazyStats
Want to improve engagement rate without guessing?
Engagement rate isn't about keeping people longer
Frequently Asked Questions
EazyStats Team
Product & Growth at EazyStats
The EazyStats team writes about web analytics, privacy, GDPR compliance, and building SaaS products that grow.
Related Articles
Engagement Rate vs Bounce Rate (What's the Difference + Which Matters More?)
Learn the difference between engagement rate and bounce rate, how engagement rate works in Google Analytics, what a good engagement rate looks like, and how to improve both metrics.
EazyStats Team
Mar 5, 2026
How to Reduce Bounce Rate (Proven Methods That Actually Work)
Learn how to reduce bounce rate with practical, proven methods. Fix high bounce rate issues, improve engagement rate, and increase website conversions.
EazyStats Team
Mar 5, 2026
Why Visitors Leave Your Website (17 Common Reasons + Fixes)
Discover why visitors leave your website quickly and how to reduce bounce rate with simple fixes that improve engagement and conversions.
EazyStats Team
Mar 5, 2026
Start tracking smarter — for free
Cookie-free, GDPR-compliant analytics. Up and running in minutes.
Create free account