Bounce Rate Meaning (Deep Guide + How to Reduce It in 2026)
Learn the true bounce rate meaning, bounce rate definition, average bounce rate by industry, what a good bounce rate is, and how to reduce bounce rate step-by-step.
EazyStats Team
Product & Growth · Published March 5, 2026
Bounce rate is one of the most misunderstood metrics in website analytics.
If you've searched for:
- Bounce rate meaning
- Bounce rate definition
- High bounce rate
- Average bounce rate
- Good bounce rate
- How to reduce bounce rate
This guide will explain it clearly — in plain English. No jargon. No confusion. And more importantly, you'll understand what to actually do about it.
What Is Bounce Rate? (Simple Definition)
Bounce rate is the percentage of visitors who leave your website after viewing only one page.
That's it.
- Someone lands on your homepage and leaves without clicking anything else — that's a bounce.
- Someone visits your pricing page and closes the tab — that's a bounce.
Example: 10 people visit your website.
- 4 explore multiple pages
- 6 leave immediately
Bounce rate = 60%
That's the bounce rate meaning in its simplest form.
Bounce Rate Meaning With Real Examples
Bounce rate alone doesn't tell you the full story. Here's why context matters.
Scenario 1: SaaS Homepage
100 visitors land on your homepage:
- 55 leave immediately
- 45 click through to features
Bounce rate = 55%
This suggests:
- Your headline may be unclear
- Visitors aren't immediately convinced
- Messaging may not match the traffic source
Scenario 2: Blog Post
100 visitors land on a blog article:
- 70 read the article fully
- 65 leave afterward
- 5 click to another page
Bounce rate = 65%
Is 65% bad for a blog?
Bounce Rate vs Exit Rate
Many people confuse bounce rate with exit rate. Here's the difference:
| Metric | What It Measures | Example |
|---|---|---|
| Bounce Rate | Visitor leaves after viewing only one page | Lands on homepage → closes tab |
| Exit Rate | Visitor leaves on that page, but may have viewed others first | Homepage → Features → Pricing → closes tab (exit from Pricing) |
Key insight
To understand how visitors move through your site, see our guide on How to Track Website Traffic.
What Is a Good Bounce Rate?
There is no universal "best bounce rate." However, here are typical healthy ranges:
| Page / Site Type | Healthy Bounce Rate | Red Flag |
|---|---|---|
| Blog / Content | 65–80% | Above 90% with low time-on-page |
| SaaS Homepage | 40–60% | Above 70% |
| Ecommerce | 30–50% | Above 65% |
| Landing Page | 50–70% | Above 85% with low conversions |
| B2B Product Page | 40–60% | Above 75% |
Always pair with engagement rate
Average Bounce Rate by Industry
Industry affects bounce rate significantly. Do not compare a blog to an ecommerce store.
| Industry | Average Bounce Rate |
|---|---|
| News / Media | 70–85% |
| B2B SaaS | 45–60% |
| Ecommerce | 30–50% |
| Lead Generation | 40–60% |
| Landing Pages | 50–70% |
| Blogs | 65–80% |
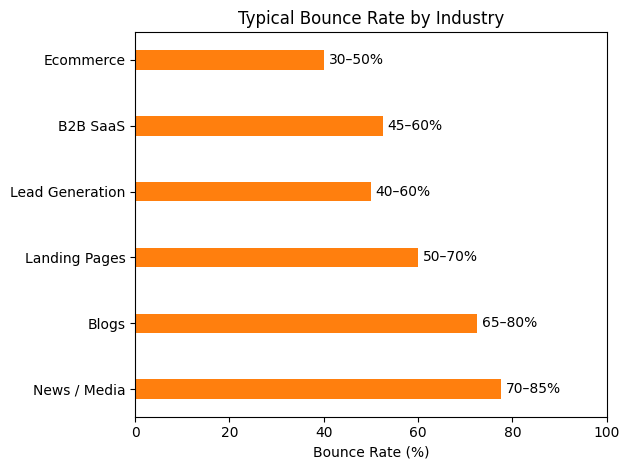
No official benchmarks exist
For a detailed breakdown by industry with 2026 benchmarks, see: Average Bounce Rate by Industry (2026 Benchmarks).
What Causes a High Bounce Rate?
A high bounce rate almost always signals friction. Here are the most common causes:
1. Weak Headline
If visitors can't understand what you do within 5 seconds of landing, they leave. Your headline must immediately answer: what is this, who is it for, and why should I care?
2. Slow Page Speed
If your site takes 4+ seconds to load, bounce rate increases dramatically. Every extra second of load time reduces engagement and increases exits.
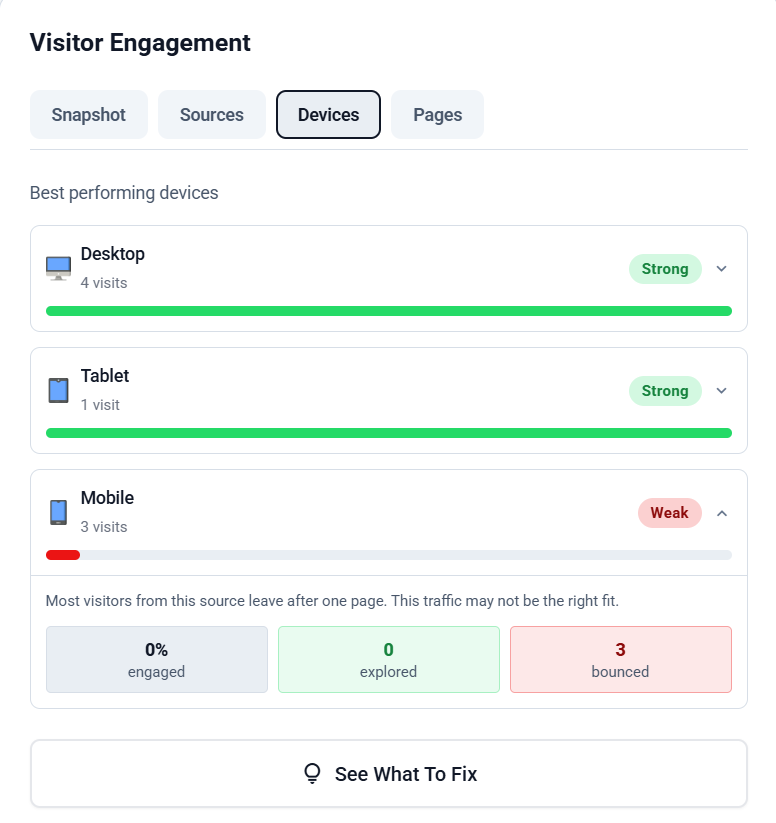
3. Poor Mobile Design
Mobile traffic now dominates most websites. Poor mobile UX — tiny text, broken layouts, hard-to-tap buttons — translates directly into high bounce rate.
4. Mismatched Traffic
If someone clicks an ad expecting one product and lands on an unrelated page, they bounce. Traffic source alignment is critical.
5. Intrusive Popups
Aggressive popups that appear immediately — especially on mobile — push visitors away before they've had a chance to engage with your content.
6. No Clear Next Step
If there's no visible call-to-action, visitors don't know where to go next. A clear CTA reduces bounce by giving visitors a natural path forward.
How to Reduce Bounce Rate (Step-by-Step)
Reducing bounce rate is not complicated. It requires clarity and intentional design.
Step 1: Improve Above-the-Fold Clarity
Your headline must immediately answer three questions:
- What is this?
- Who is it for?
- Why should I care?
Clear, specific messaging reduces bounce immediately.
Step 2: Improve Page Speed
Target under 2 seconds load time. Use:
- Compressed images (WebP format)
- A CDN for static assets
- Minimal third-party scripts
- Lazy loading for offscreen content
Analytics script weight matters
Step 3: Optimize Mobile Experience
Ensure:
- Buttons are thumb-friendly (minimum 44px tap target)
- Text is readable without zooming
- No popups block content on mobile
- Layout doesn't break on small screens
Mobile bounce rate is often the biggest leak in a site's engagement.
Step 4: Add Internal Links
Internal links reduce bounce rate by encouraging exploration. Every article or page should naturally guide visitors to a relevant next step.
For example: understanding how engagement rate relates to bounce rate helps you interpret both metrics correctly. You can also study why visitors leave your website to address root causes, and use customer journey analysis to map the paths your best-converting visitors actually take.
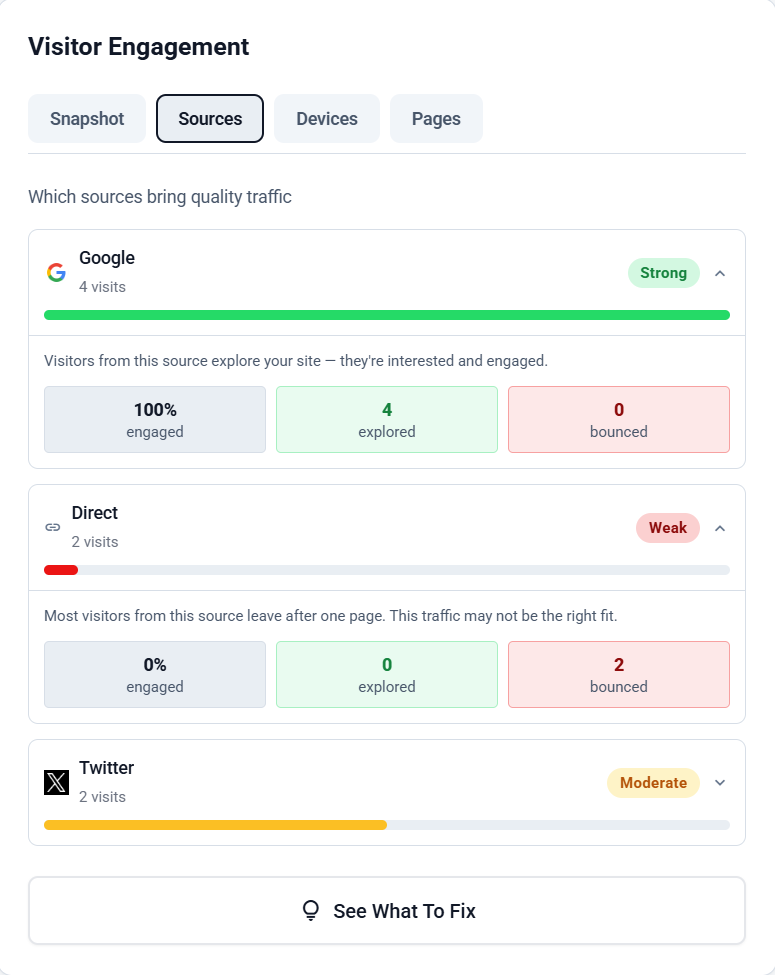
Step 5: Align Traffic Sources
If LinkedIn traffic explores your site but Facebook traffic bounces, focus your effort on LinkedIn. Tracking traffic quality — not just volume — is what drives improvement.
See our full tactical guide: How to Reduce Bounce Rate (10 Proven Tactics). If you also want to lift the positive side of the equation, see how to improve engagement rate.
See exactly who explored vs who left
Bounce Rate in Google Analytics (Why It's Confusing)
Google Analytics shows:
Bounce rate: 62%
That's it. It doesn't show:
- How many visitors explored multiple pages
- Which traffic source caused friction
- Which specific page lost visitors
- Whether your bounce rate is healthy or a red flag
GA4 also changed the bounce rate definition — it now measures sessions with no engagement events, which gives different numbers than the classic Universal Analytics definition. This makes year-over-year comparison difficult.
That's why many founders search for a Google Analytics alternative: they want clarity, not a confusing metric with a shifting definition.
Bounce Rate vs Engagement Rate
These two metrics are two sides of the same coin:
| Metric | What It Tells You | Ideal Direction |
|---|---|---|
| Bounce Rate | Percentage who left after one page | Lower is generally better |
| Engagement Rate | Percentage who explored deeper (multiple pages) | Higher is better |
Example: 10 visitors arrive.
- 7 explore multiple pages → engagement rate = 70%
- 3 leave immediately → bounce rate = 30%
To understand the full relationship between these metrics, read our dedicated guide: Engagement Rate vs Bounce Rate.
When a High Bounce Rate Is NOT a Problem
Sometimes a high bounce rate is expected and completely acceptable. Examples:
- FAQ pages — visitors find their answer and leave satisfied
- Contact pages — visitors arrive, find your email/phone, and leave
- Single-purpose landing pages — the only action is the CTA; everything else is irrelevant
- Blog posts answering one specific question — the content fulfilled its purpose
The real problem is when a high bounce rate combines with:
- Low conversions
- Low engagement rate
- Short average session duration
The dangerous combination
Bounce rate doesn't have to be confusing. When you can see exactly who explored, who left, and where they dropped off — you know precisely what to fix.
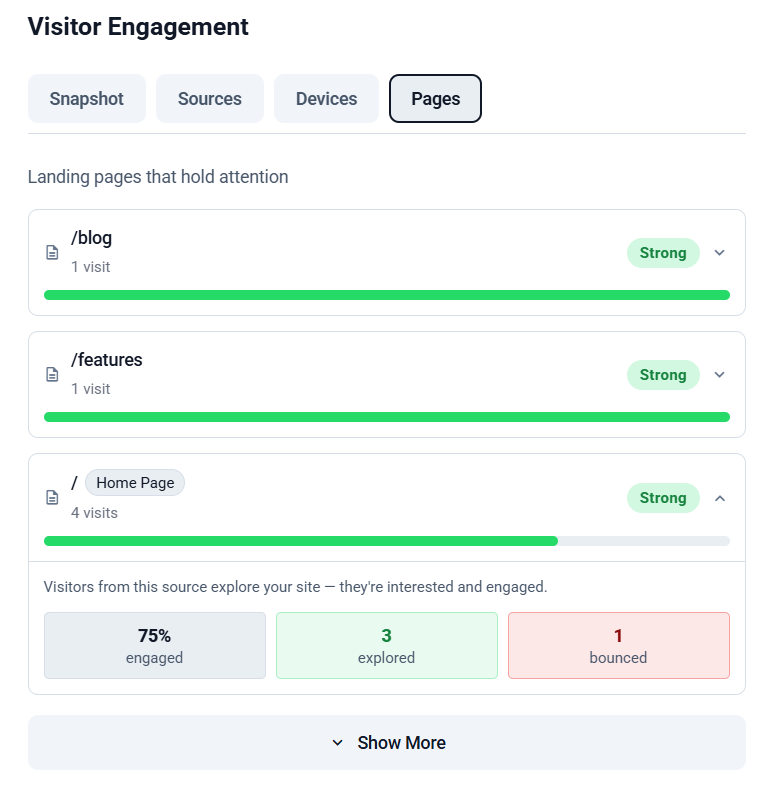
What Bounce Rate Looks Like Inside EazyStats
Instead of a single percentage, EazyStats breaks visitor behavior into four distinct groups — so you immediately see who bounced, which page caused it, and which traffic source to prioritize.
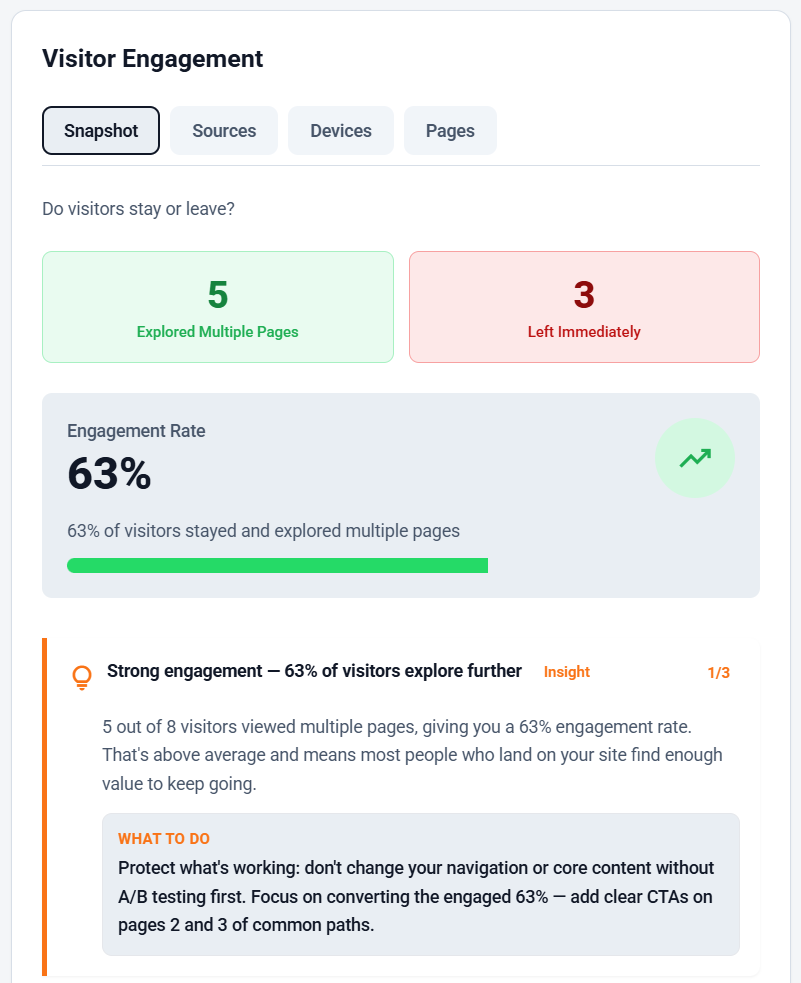
Track bounce rate the simple way
Frequently Asked Questions
EazyStats Team
Product & Growth at EazyStats
The EazyStats team writes about web analytics, privacy, GDPR compliance, and building SaaS products that grow.
Related Articles
Engagement Rate vs Bounce Rate (What's the Difference + Which Matters More?)
Learn the difference between engagement rate and bounce rate, how engagement rate works in Google Analytics, what a good engagement rate looks like, and how to improve both metrics.
EazyStats Team
Mar 5, 2026
How to Reduce Bounce Rate (Proven Methods That Actually Work)
Learn how to reduce bounce rate with practical, proven methods. Fix high bounce rate issues, improve engagement rate, and increase website conversions.
EazyStats Team
Mar 5, 2026
Average Bounce Rate by Industry (2026 Benchmarks & What's Normal)
What is the average bounce rate by industry? See 2026 benchmarks for SaaS, ecommerce, blogs, agencies, and more — and learn what a good bounce rate really is.
EazyStats Team
Mar 5, 2026
Start tracking smarter — for free
Cookie-free, GDPR-compliant analytics. Up and running in minutes.
Create free account