Average Bounce Rate by Industry (2026 Benchmarks & What's Normal)
What is the average bounce rate by industry? See 2026 benchmarks for SaaS, ecommerce, blogs, agencies, and more — and learn what a good bounce rate really is.
EazyStats Team
Product & Growth · Published March 5, 2026
If you've ever asked: "What is a good bounce rate?" — you're not alone.
Bounce rate by itself doesn't mean much. What matters is context. A 65% bounce rate might be terrible for an ecommerce product page — but completely normal for a blog article that answers one question.
In this guide you'll learn:
- the average bounce rate by industry (benchmarks you can use in 2026)
- what's considered high bounce rate vs normal
- why bounce rate varies so much
- how to improve your website bounce rate the right way
- how bounce rate connects to engagement rate (and why that matters more now)
What Is Bounce Rate?
Bounce rate is the percentage of visitors who leave your website after viewing only one page.
- 100 visitors land on your website
- 55 leave without clicking anything else
- Bounce rate = 55%
In Google Analytics 4 (GA4), bounce rate is the opposite of engagement rate: a "bounce" is a session that was not engaged. Google defines an engaged session as one that lasts at least 10 seconds, has 2+ page views, or triggers a conversion or key event. (Google Help)
But bounce rate alone doesn't explain behavior — it only tells you that someone left, not why. For the deeper meaning and how to interpret it properly, read: Bounce Rate Meaning (Complete Guide).
What Is the Average Bounce Rate Overall?
Across many websites, a commonly referenced overall average range is around 40% to 60%.
But this range is wide because bounce rate changes based on: industry, traffic source (Google vs social vs email), device type (mobile vs desktop), page type (blog vs pricing page), and visitor intent (information vs purchase).
That's why comparing your average website bounce rate to a random benchmark can be misleading. The right question is:
"What is the average bounce rate for my industry and page type?"
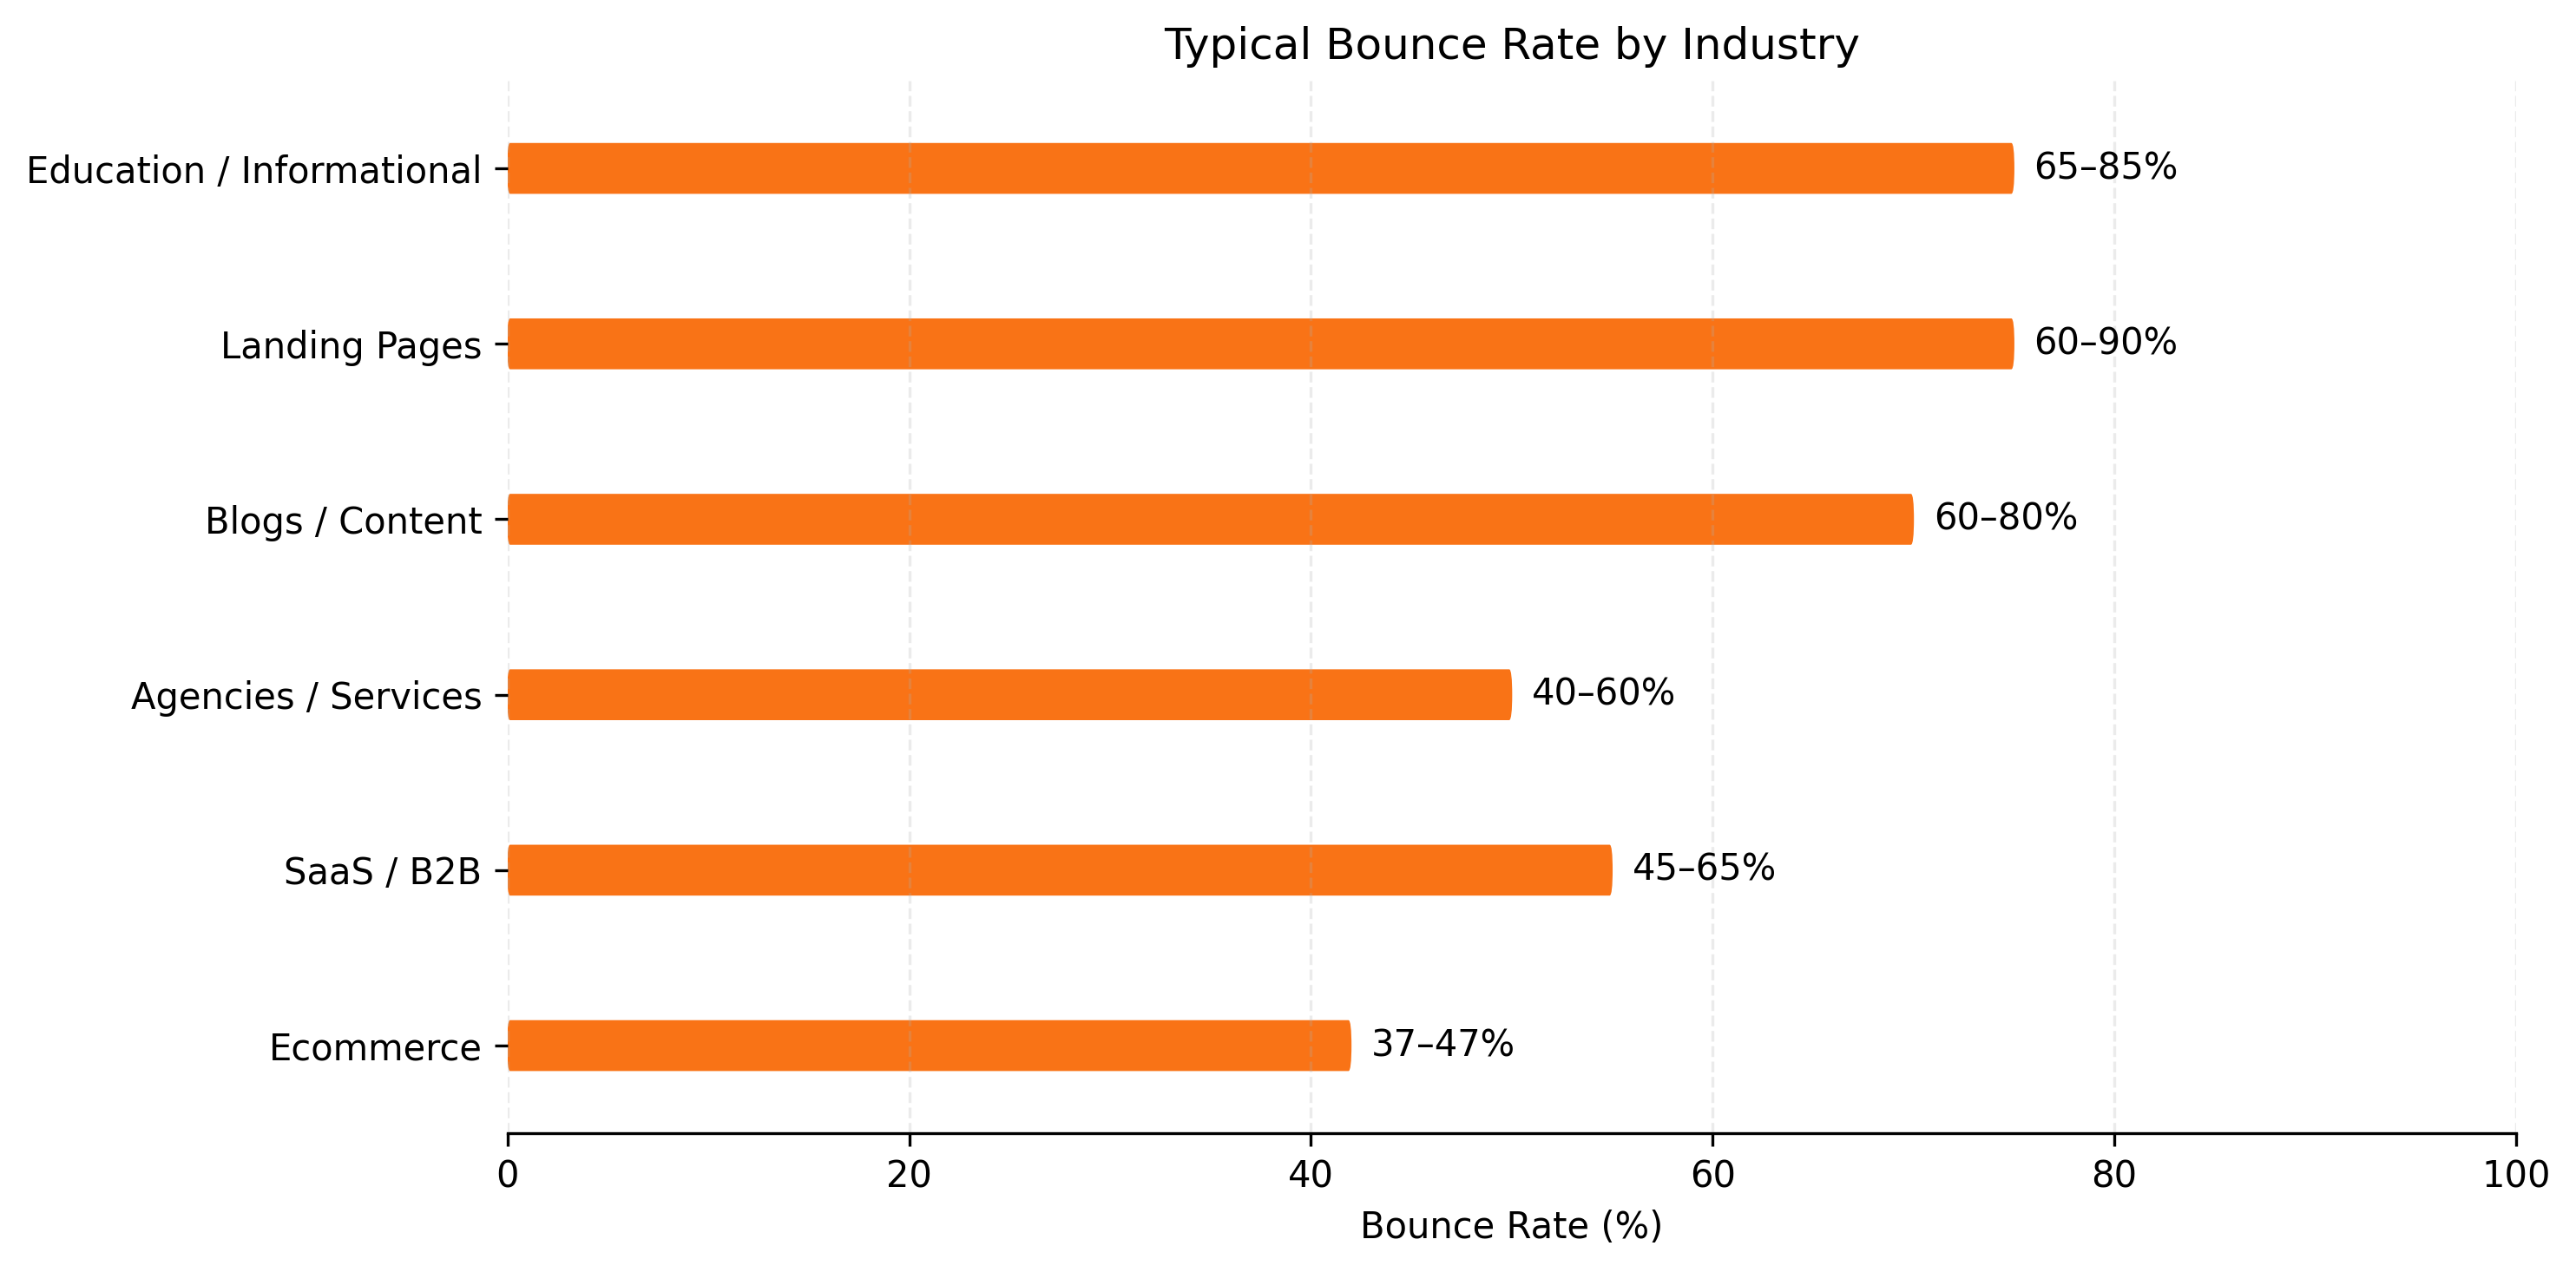
Average Bounce Rate by Industry (2026 Benchmarks)
Different sources define and measure bounce rate differently (GA4 vs other tools). Treat these as directional ranges — not absolute truth.
| Industry / Site Type | Typical Bounce Rate Range | Why it's like this |
|---|---|---|
| Ecommerce | ~37%–47% | Shoppers browse categories/products; speed + UX matter |
| SaaS / B2B websites | ~45%–65% | Visitors evaluate value, features, pricing; clarity matters |
| Agencies / service businesses | ~40%–60% | Trust + offer clarity determines exploration |
| Blogs / content sites | ~60%–80%+ | Informational intent; many users read one page and leave |
| Landing pages (paid traffic) | ~60%–90% | Ad–intent mismatch is common; single-purpose pages bounce high |
| Education / info sites | ~65%–85% | "Answer-seeking" sessions often end after one page |
SaaS Websites: Average Bounce Rate
Typical bounce rate range: 45%–65%
Why SaaS bounce rates sit here:
- Homepage traffic is often "curiosity" traffic
- Visitors compare tools quickly
- Many sessions end after checking one page if messaging is unclear
High bounce rate on SaaS often signals:
- Confusing above-the-fold message or weak positioning
- Unclear CTAs ("learn more" loops)
- Slow mobile UX
Ecommerce Stores: Average Bounce Rate
Typical bounce rate range: ~37%–47% is commonly reported for ecommerce, with market datasets showing rates around the mid-40s in early 2026.
Why ecommerce tends to bounce less than blogs: visitors browse products, compare categories, and explore multiple items.
If ecommerce bounce rate goes above 60%, it often points to:
- Slow product pages
- Poor mobile UX
- Pricing or shipping details hidden below the fold
- Ad mismatch (promotion promised but not shown)
- Low trust signals (no reviews, unclear returns)
Behavior example: If TikTok traffic lands on a product page that loads slowly and hides the price, many users leave instantly. Showing the key value and price immediately often reduces bounce significantly. For the complete list of causes and fixes: Why Visitors Leave Your Website (17 Reasons + Fixes).
Blogs & Content Sites: Average Bounce Rate
Typical bounce rate range: 60%–80%+ — often "normal" for informational content.
Many blog visitors search one question, read one page, and leave. That's still a successful session if the intent was "get the answer." For blogs, better performance goals are:
- Increase time on page
- Increase internal clicks ("read next")
- Improve scroll depth
- Grow email sign-ups
If your blog is part of a product funnel, high bounce becomes a problem when visitors never click to product, feature, or pricing pages — which is why internal linking is such a big lever for content sites.
Blog internal linking tip
Agencies & Service Businesses: Average Bounce Rate
Typical bounce rate range: 40%–60%
Service business visitors often follow a predictable journey: homepage → services → portfolio/case studies → contact. For a full guide on mapping and optimizing that journey: Website Customer Journey: How to Map & Optimize It.
If bounce is high, it usually means:
- Unclear offer or generic service descriptions
- Weak trust signals (no case studies or proof)
- Confusing navigation
- Wrong traffic (low-intent clicks)
Behavior example: If visitors land on "Digital Transformation Services" but the page is vague, they bounce. If the page states concrete outcomes ("Reduce reporting time by 40%") with proof, they explore.
Landing Pages (Paid Traffic): Average Bounce Rate
Typical bounce rate range: 60%–90% is widely cited for landing pages.
Why it's high:
- Paid traffic is fast and impatient
- Ad mismatch is common
- Landing pages are often single-purpose (so "one page and leave" happens naturally)
This is where you should focus on: headline match to ad copy, page speed, CTA clarity, and trust proof above the fold.
Educational / Informational Sites: Average Bounce Rate
Typical bounce rate range: 65%–85%
These sites have a strong "answer-seeking" pattern. Visitors arrive, read the answer, and leave. High bounce rate isn't always bad — unless you're trying to drive deeper exploration such as course sign-ups or product trials.
Why Bounce Rate Varies by Industry
Bounce rate depends on intent + friction. Here are the biggest drivers:
| Driver | Effect on Bounce Rate |
|---|---|
| User intent (transactional vs informational) | Transactional explores more; informational often ends after one page |
| Traffic source | Direct explores deeper; social often bounces higher; paid bounces if ad ≠ page |
| Device type | Mobile sessions bounce more due to speed, popups, and layout friction |
| Page type | Blog posts bounce higher; pricing pages should bounce lower with qualified traffic |
| Content clarity + UX | Speed, above-fold clarity, CTA visibility, internal links all affect bounce |
What Is a Good Bounce Rate?
There is no single "good bounce rate." A better way to evaluate is:
- Is bounce rate improving over time?
- Is engagement rate improving?
- Are visitors reaching key pages (features/pricing/demo)?
- Are conversions improving?
What "good" looks like in practice:
Instead of only seeing Bounce rate: 62%, you should see a behavioral breakdown:
- 4 visitors explored multiple pages
- 3 visited features
- 1 reached pricing
- 5 left immediately
That breakdown gives direction. For the step-by-step playbook to act on it, read: How to Reduce Bounce Rate (Proven Fixes).
How to Reduce Bounce Rate (Industry-Agnostic Fixes)
No matter your industry, the biggest bounce reducers are the same:
- Improve page speed — faster pages reduce immediate exits
- Improve messaging clarity — clear headline + benefit reduces confusion bounces
- Improve internal linking — guide visitors deeper into the journey, especially on blogs
- Improve traffic quality — wrong audience means high bounce
- Improve mobile UX — mobile friction increases bounce significantly
Reducing bounce rate is mainly about clarity, not hacks. See the full guide: How to Reduce Bounce Rate.
Bounce Rate vs Engagement Rate
Bounce rate measures exits and non-engaged sessions (in GA4). Engagement rate measures meaningful interaction. GA4 explicitly frames bounce rate as the opposite of engagement rate — so if bounce rate is 60%, engagement rate is roughly 40%. (Google Help)
That's why obsessing over bounce rate alone can create unnecessary anxiety. A healthier approach:
- Reduce bounce where it matters (pricing pages, landing pages)
- Increase engagement overall (internal clicks, journeys, conversions)
Relevant reads:
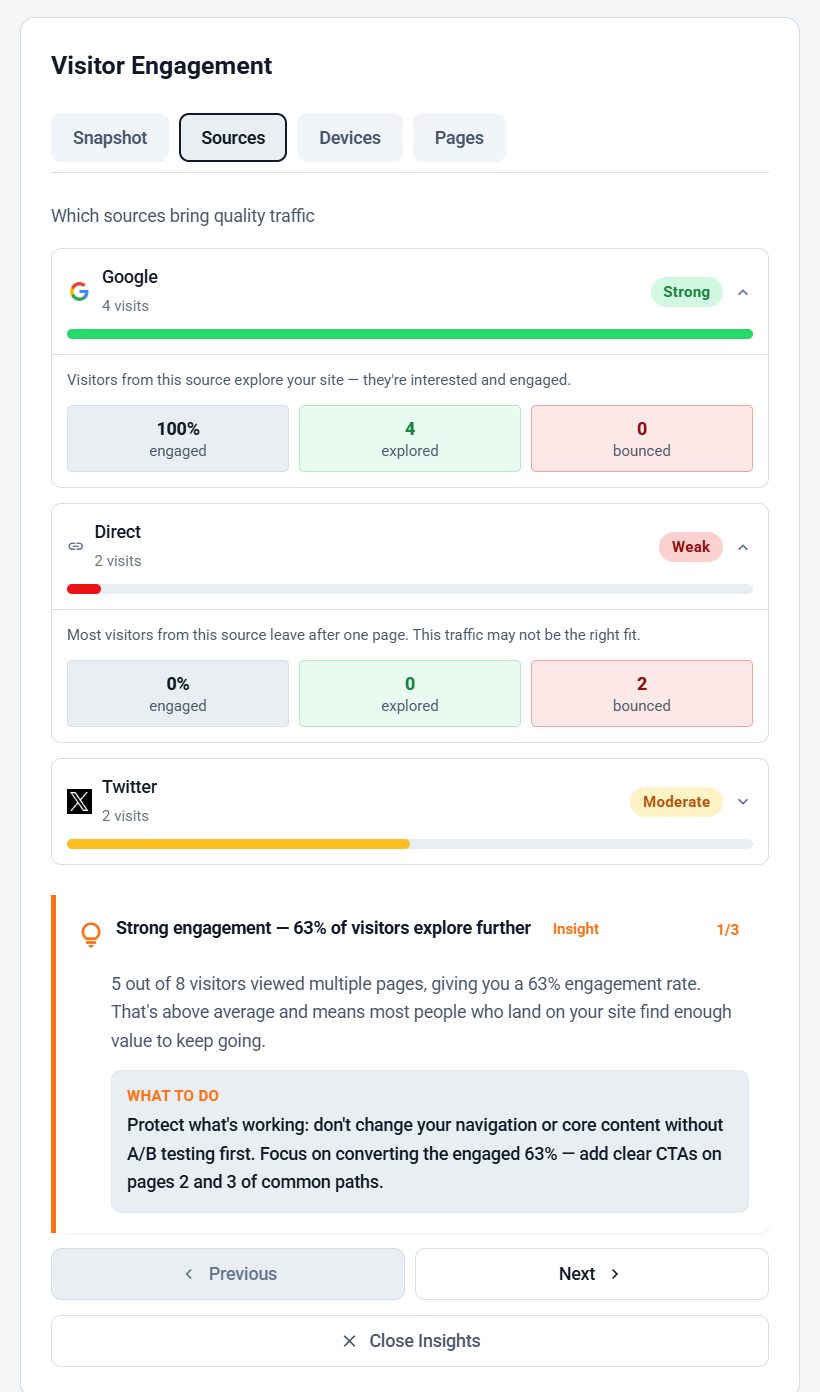
See This Inside EazyStats
Benchmarks are helpful, but they don't tell you what your visitors actually did. EazyStats is built to translate visitor behavior into decisions:
- Who explored multiple pages
- Who reached features or pricing
- Where visitors drop off
- Which channels bring buyers vs browsers
The result: behavior → interpretation → clear action — not just dashboards full of numbers.
To see how EazyStats compares to other tools: Website Visitor Tracking Tools Compared (2026).
Stop comparing to averages
Want to see real visitor behavior — not just averages?
Stop comparing blindly — understand your own visitors
Frequently Asked Questions
EazyStats Team
Product & Growth at EazyStats
The EazyStats team writes about web analytics, privacy, GDPR compliance, and building SaaS products that grow.
Related Articles
Bounce Rate Meaning (Deep Guide + How to Reduce It in 2026)
Learn the true bounce rate meaning, bounce rate definition, average bounce rate by industry, what a good bounce rate is, and how to reduce bounce rate step-by-step.
EazyStats Team
Mar 5, 2026
How to Reduce Bounce Rate (Proven Methods That Actually Work)
Learn how to reduce bounce rate with practical, proven methods. Fix high bounce rate issues, improve engagement rate, and increase website conversions.
EazyStats Team
Mar 5, 2026
Why Visitors Leave Your Website (17 Common Reasons + Fixes)
Discover why visitors leave your website quickly and how to reduce bounce rate with simple fixes that improve engagement and conversions.
EazyStats Team
Mar 5, 2026
Start tracking smarter — for free
Cookie-free, GDPR-compliant analytics. Up and running in minutes.
Create free account